A very useful and important tool that can be used to analyze performance on windows server infrastructure is the PAL tool. Download from http://pal.codeplex.com/. This tool provides the ability to set a Performance Counter profile, export it to a Data Collector Set, and then import the results for analysis.
Using the tool:
Download, run and install the tool (requirement dot net 3.5)
Open PAL tool

Change to Threshold File and choose the type of analysis you want (exchange 2013 for example…)
Export the file to your local path.


Copy the xml file to the designated server you want to analyze, exchange 2013 server as for our example.
Open Performance monitor on the server.

Add a new User defined data set using the exported Template


Select and click finish.
Right click on the Data collection set and Start collecting performance data (eg 30 min or 1h to minimize peak congestions)

Stop the data collection and copy the raw performance data file .blg to your analysis machine. The file self is saved by default under: %SYSTEMDRIVE%\PerfLogs
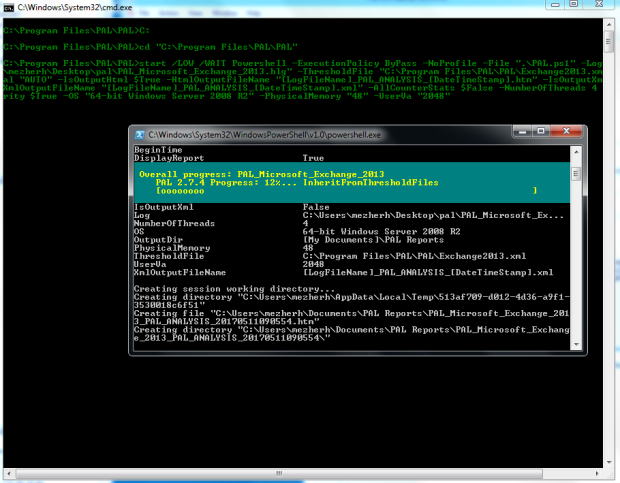
Go back to PAL Wizard and define the raw data file to analyze


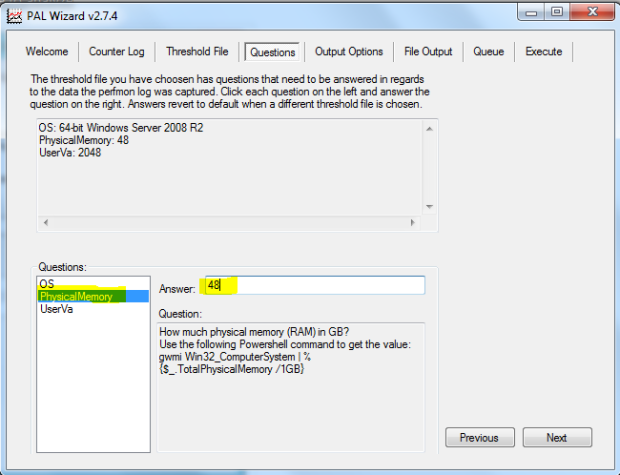
Follow the wizard and click next, finish.


1 Comment